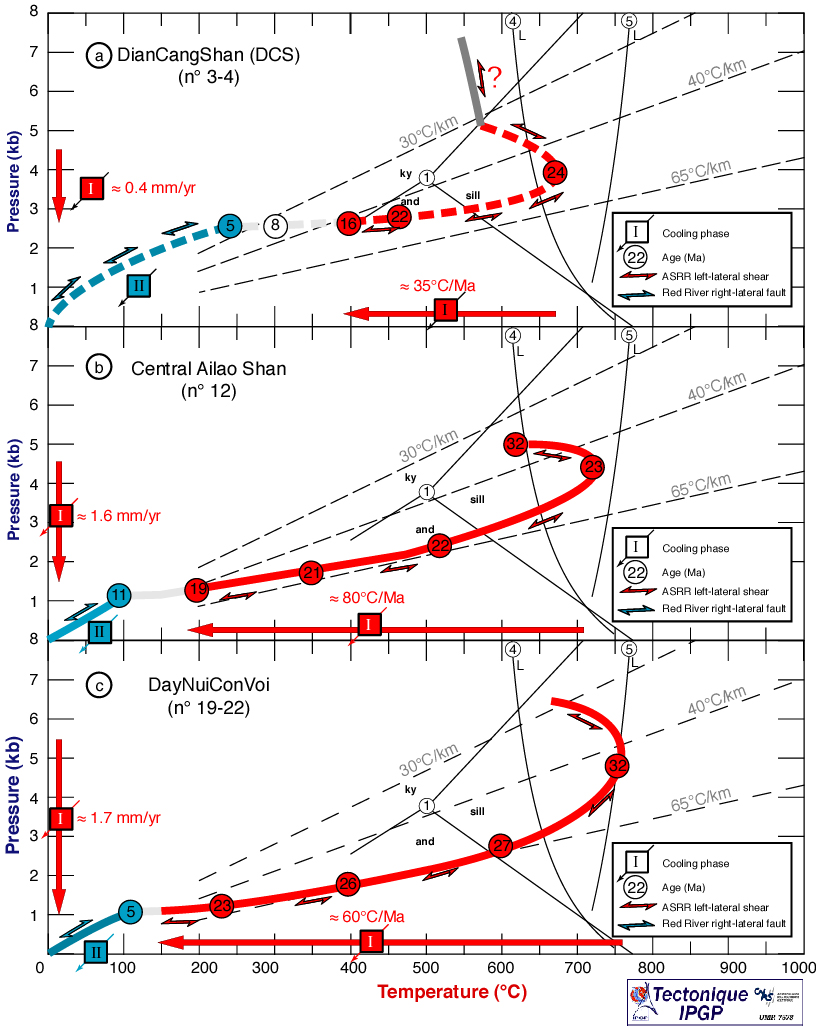
Les grandes flèches parallèles aux axes des températures et des pressions indiquent le refroidissement et la décompression au cours de la phase I. Les chiffres entourés indiquent la chronologie en Ma. Les petites flèches indiquent le sens de cisaillement: sénestre (rouge) ou dextre (bleu). Le point triple des silicates d'alumine et les courbes de fusion partielle (4 & 5) sont identiques à celles de La figure 15h.
a) Massif du Dian Cang Shan range (coupes 3 et 4).
b) Ailao Shan central (coupe 12).
c) DayNuiConVoi central (coupes 19 à 22).
Figure 19 P-T-t-Deformation paths in the ASRR (Leloup et al., 2001).
Large arrows parallel to temperature and pressure axis respectively show cooling and decompression during cooling phase I. Circled numbers are time estimations (Ma). Small arrows show shear sense at that time: sinistral (red) or dextral (blue). Aluminosilicate triple point and partial melting curves 4 and 5 as in figure 15h.
a) Dian Cang Shan range (sections 3 and 4).
b) Central Ailao Shan range (section 12).
c) Central DayNuiConVoi range (sections 19 to 22).